Solubility Graphs for Compounds in Water
Chem 1010 Ch 15 Solubility Graphs
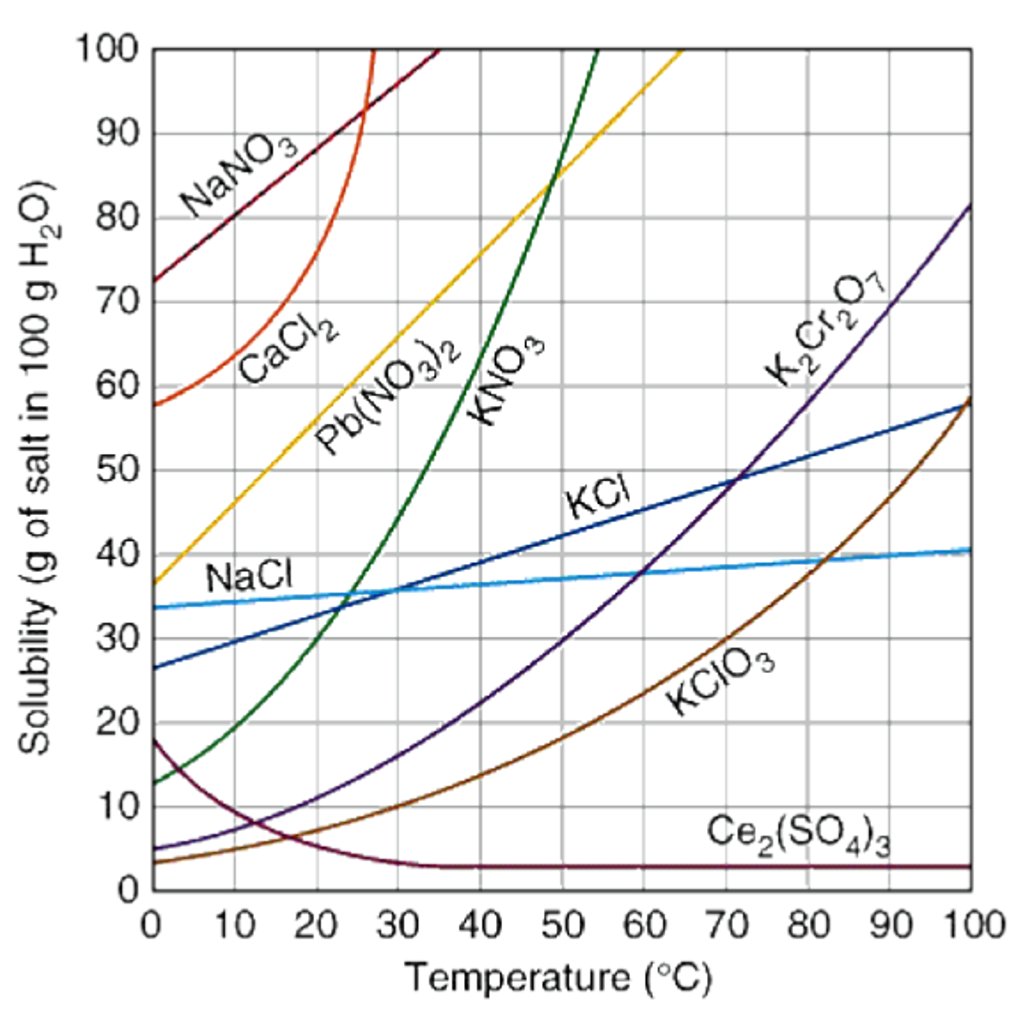
Dive into the fascinating world of chemistry with this interactive space focused on solubility. Students will learn to read and interpret solubility tables, analyze solubility graphs, and understand how temperature affects the solubility of various compounds. This hands-on experience is designed to enhance their comprehension of solubility concepts in a practical and engaging way.
Create. Personalize. Engage.
Built by educators for educators
Copyright © 2025 SchoolAI. All rights reserved.