District data visibility across classrooms: A practical guide for school leaders
How districts connect classroom data into real-time dashboards without breaking FERPA rules.
Cheska Robinson • Jul 21, 2026
School & District Leadership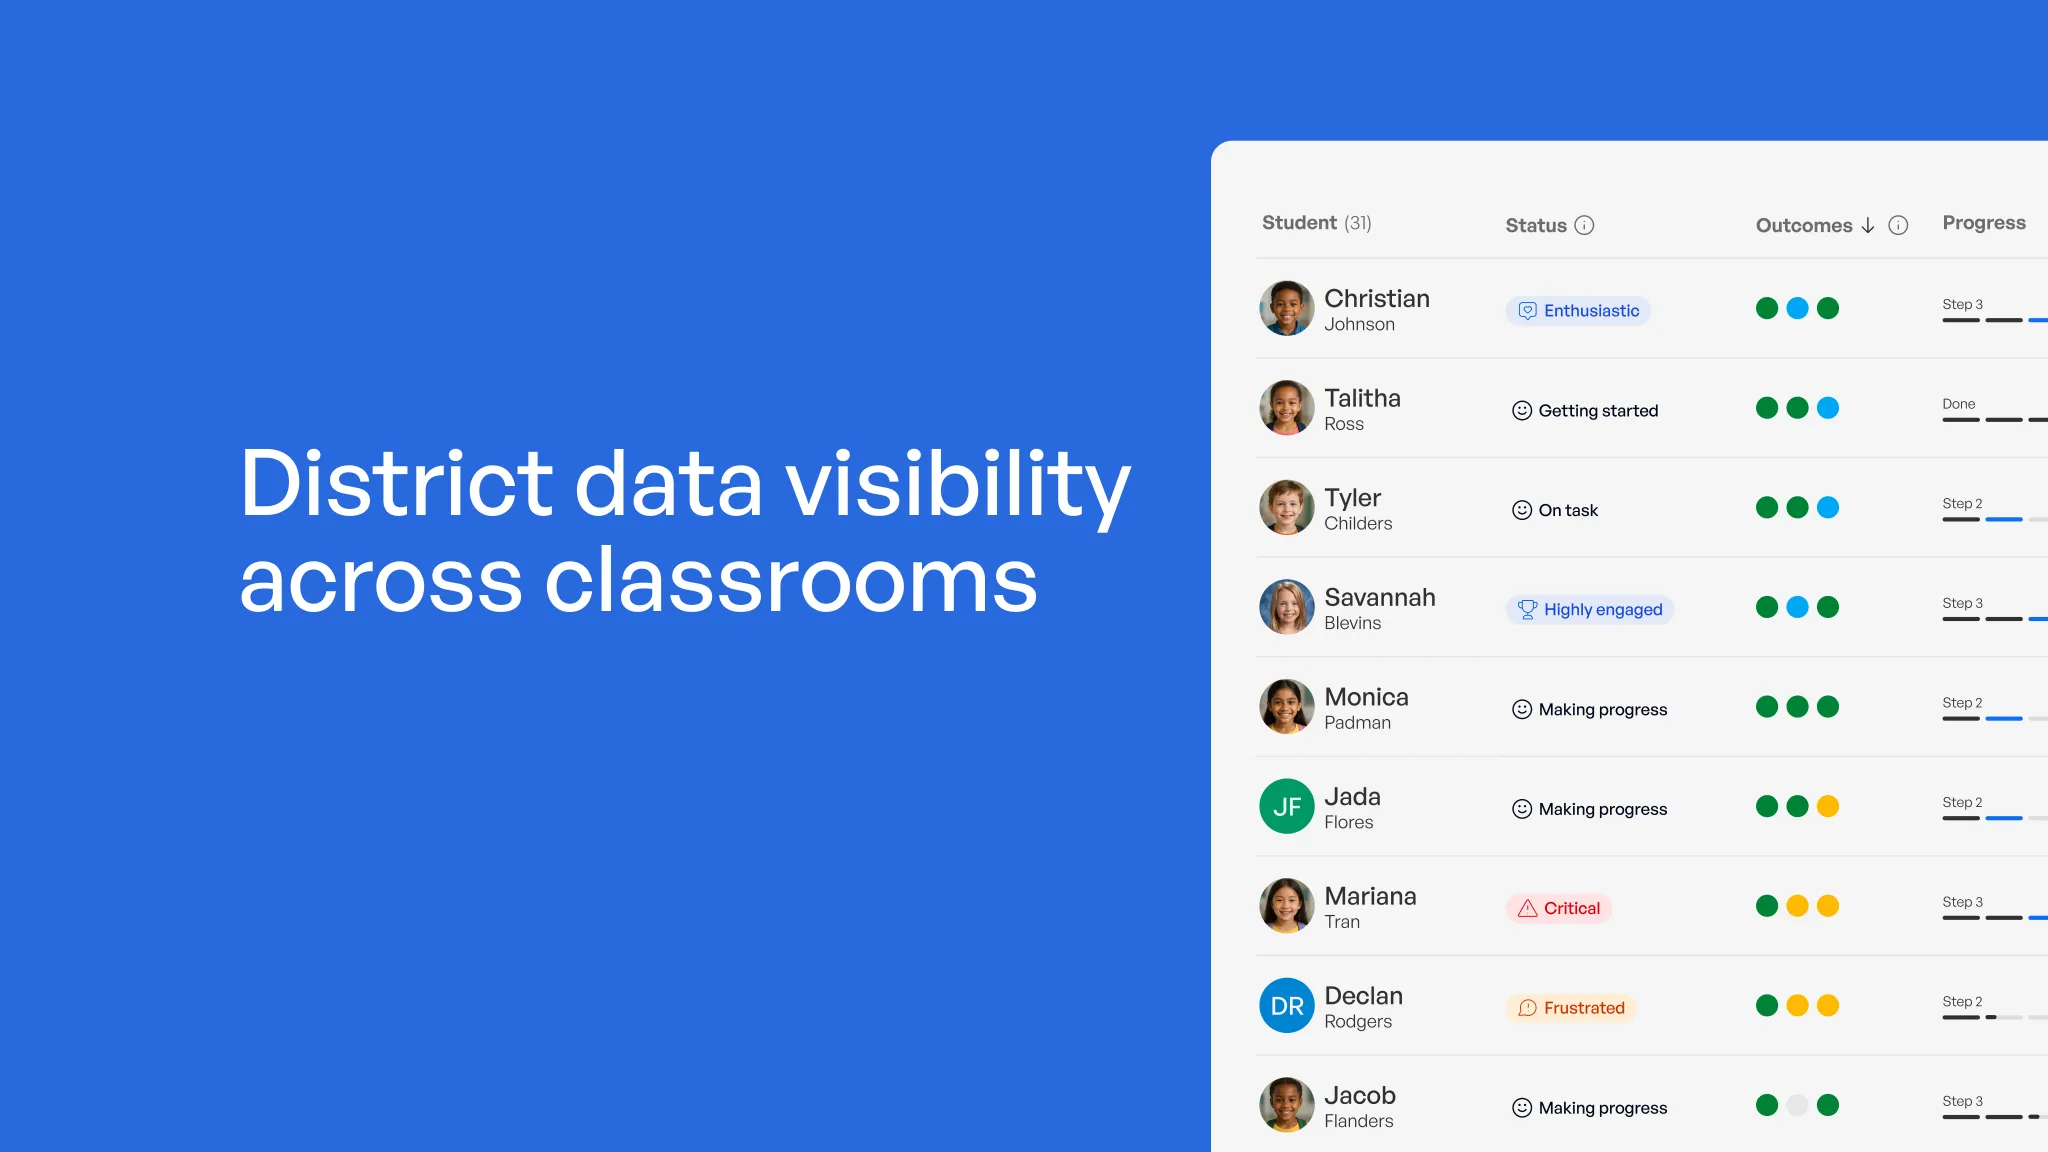
District data visibility across classrooms: A practical guide for school leaders
School leaders talk about data all the time, but there's a gap between having data and actually being able to use it. Most districts collect information from classrooms (attendance, grades, assessment scores, engagement metrics), but that data lives in separate systems. A principal might see attendance dashboards. A teacher sees gradebook data. A curriculum coordinator tracks assessment trends. They're all looking at pieces of the same picture, but they're not seeing the whole thing together.
The problem isn't that districts lack data. It's that the data isn't visible in a way that lets school leaders see what's actually happening across classrooms right now.
What district data visibility across classrooms really means
District data visibility means connecting your central systems (student information system, assessment platforms, behavior logs) with classroom-level dashboards so academic metrics, attendance, and engagement are visible in real time, not just at report-card time. Instead of waiting for quarterly reports, principals can see which classrooms are thriving and which ones need support right now. Teachers can spot a learning gap the week it appears, not months later. It's about turning data that already exists in your systems into information that actually guides decisions.
Here's the core tension: districts want transparency across schools and classrooms, but that transparency has to respect FERPA and role-based limits on who sees what. You can't give everyone access to everything. The districts that get visibility right build it with privacy built in from the start, not added after the fact.
Most districts already have the data they need. It's not trapped in missing records or incomplete assessments. It's trapped in siloed software that doesn't talk to itself. Your SIS doesn't share with your assessment platform. Your behavior log lives in a separate tool. Teachers have to manually reconcile numbers across three different dashboards. That's the actual bottleneck: not more data collection, but visibility into the data you already have.
This article covers the pillars that make visibility work, who should see what at each level, the challenges districts run into, and the best practices for rolling it out without breaking FERPA or overwhelming your staff.
Key takeaways
Real-time visibility lets you catch learning gaps weekly instead of quarterly, before they become formal interventions. When a student moves to a new grade or school, the receiving teacher sees their full academic history and support needs instead of starting blank. Administrators can compare course placements, discipline referrals, and resource allocation across schools to spot patterns and disparities that wouldn't show up looking at any single building alone. Visibility only works when access is role-based, data is interoperable across platforms, and staff have time to actually use it.
Why district data visibility matters
Targeted interventions. Teachers can view a student's historic performance data (prior grades, attendance patterns, past intervention notes) and catch a learning gap the week it appears instead of at the next grading period. A student who's started missing days or whose responses are getting shorter and less detailed shows up on the dashboard before a crisis happens. That early signal changes everything about intervention timing.
Smoother transitions. When a student moves to a new grade, class, or school within the district, the receiving teacher instantly sees academic history and support needs instead of starting from a blank slate. No more "I didn't know she was already getting reading support" or "I have no idea what his IEP actually says." The new teacher sees the full picture on day one.
Spotting systemic patterns. Administrators can compare course placements, disciplinary referrals, and resource allocation across schools and classrooms to spot patterns that wouldn't show up looking at any single building in isolation. Visibility surfaces questions like: why do certain schools have higher special education referrals? Which classrooms are placing students in advanced math at lower rates? Are some groups of students getting fewer opportunities for higher-order thinking? Those patterns matter, and visibility is what makes them visible.
Collaborative care. Specialists, counselors, and general education teachers can all track the same student's progress from their own dashboards, coordinating support instead of duplicating or contradicting it. A speech-language pathologist sees what a student's reading teacher is working on. A counselor knows when a student's grades are sliding. Everyone's pulling in the same direction instead of in isolation.
The core pillars of district-wide visibility
1. Data interoperability.
Fragmented platforms (student information systems, behavioral logs, assessment tools, attendance software) need to feed a single source of truth instead of living in disconnected silos. Standards like OneRoster and Ed-Fi let districts sync roster, schedule, and gradebook data automatically instead of re-entering it every marking period. Systems built for early-warning signals combine attendance, academic, and behavioral data so at-risk students surface before problems escalate into formal disciplinary or intervention cases. When your platforms talk to each other, your data works for you instead of against you.
2. Real-time dashboards.
Districts are moving away from "autopsy data" (test results analyzed months after a semester ends) toward quick-cycle analytics teachers can act on the same week. Dashboards that break performance down by grade level and specific curriculum standard give teachers a sharper signal than one aggregate score ever could. Real-time views that show which students are engaged, which are stuck, and what to try next turn a dashboard into a daily instructional tool rather than a quarterly report. When a teacher can see mastery by standard in real time, she adjusts instruction before students move on to the next concept.
3. Observation and consistent standards.
District leaders can't sit in every classroom, so walkthrough and instructional observation data need to roll up into one consistent, district-wide view. Pairing quantitative dashboard data with qualitative observation notes side by side helps leaders catch patterns, like which schools have disparate course placements or disproportionate referrals, that neither data type would reveal alone. Visibility isn't just about numbers. It's about seeing patterns across classrooms that point to where your systems need to shift.
Role-based access: who should see what
Superintendents and district administrators: full access to aggregated, district-wide data with the ability to drill down into any individual school or student when needed. They see trends across the district, resource allocation by school, and early-warning signals that tell them where support is most urgent.
Principals and school administrators: complete visibility into every classroom within their own building, useful for walkthroughs, staffing decisions, and performance reviews. They see which teachers are engaging students at high levels, which classrooms have stronger attendance, and where targeted support would help most.
Instructional coaches: view-only or edit access scoped to the specific grade levels or subjects they support, not the whole building. They drill deep into the classrooms they're coaching, seeing mastery data and engagement patterns that inform their coaching conversations.
Classroom teachers: full access to their own roster, with other classrooms restricted by default to protect student privacy. Teachers see every student's mastery by standard, attendance, and engagement patterns so they can make real-time instructional adjustments and flag students who need intervention.
This role-based approach respects FERPA while making visibility actionable. Everyone sees what they need to do their job. Nobody sees more than that.
🎯 See how your students actually learn.
SchoolAI gives teachers and leaders real-time visibility into every student's learning process.
Implementation challenges districts run into
FERPA compliance. Federal law strictly limits who can view personally identifiable student information, so access controls have to be designed in from the start, not added after a data breach. If your visibility system treats privacy as an afterthought, you're building on a shaky foundation. The districts that get this right build privacy into the architecture, not bolted on at the end.
Data silos. Attendance, grading, and testing tools often live in separate systems that were never built to talk to each other, forcing staff to manually reconcile numbers across platforms. A teacher has to check three different dashboards to see the full picture of a student's week. That friction kills adoption faster than anything else. You need interoperability from the start.
Rostering lag. When schedule or enrollment changes don't sync quickly, teachers can be temporarily blind to which students actually belong on their roster. A student transfers in, but the dashboard doesn't reflect it for days. A student moves to a different period, but the old section still shows them. Small lags compound into real confusion about who's in what class.
Teacher overwhelm. Dumping raw, unfiltered data into a dashboard without a clear visual hierarchy causes analysis paralysis instead of action. If a teacher logs in and sees a spreadsheet of 150 data points, they shut down. If they see color-coded risk levels and clear "next steps," they act. The design of the dashboard matters as much as the data in it.
Best practices for rolling out data visibility
Adopt ed-tech data standards. Implementing OneRoster or Ed-Fi keeps roster and gradebook data in sync automatically instead of relying on manual exports between systems. These standards are designed specifically so your platforms can talk to each other without custom integrations. They reduce friction and errors.
Enforce least-privilege access. Give every role only the data access needed to do the job. Blanket visibility by default is a privacy risk, not a convenience. A teacher doesn't need to see another teacher's classroom. A coach doesn't need to see every school. Build access policies around what people actually need, not what would be nice to have.
Build visual, color-coded dashboards. Color-coded risk levels let a teacher scan a class list and know who needs attention in seconds instead of parsing a spreadsheet. Green for on track, yellow for needs support, red for at-risk. Add clear visual hierarchy so the most important information is hardest to miss. Good design is what turns data into action.
Audit access regularly. Reviewing who looked at what data, and when, catches unauthorized viewing before it becomes a compliance problem. You can't secure what you don't measure. Regular audits also show you whether the visibility system is actually being used or whether it's sitting idle.
Designate data coaches. Early-adopter, data-savvy staff can mentor peers on turning dashboard numbers into adjusted lesson plans and interventions. They model how to read the data, what questions to ask, and how to act on what you see. They make visibility feel less like a compliance requirement and more like a tool that actually helps.
What this looks like in the classroom
A fourth-grade teacher logs in to her classroom dashboard at the start of the week. She sees a color-coded view of her 26 students: 18 are green (on track in reading), 6 are yellow (need focused support), and 2 are red (at-risk, need immediate intervention). She clicks on one of the yellow students and sees that his attendance has dropped and his participation in small-group discussions has dipped over the past two weeks. The dashboard also shows his prior grades and notes from his previous teacher about what helped him engage. She knows exactly what to do: pull him for a small group tomorrow and check in about what's happening at home.
Beyond the teacher's dashboard, students see anonymous, class-wide data walls that graph collective averages on a weekly reading or math skill. The wall shows the class's progress on "identifying the main idea" this week compared to last week. No individual names or scores. Just collective data that builds student ownership of learning. Students see that the class got stronger, and they know what they worked on to get there. That kind of visibility shifts student agency.
Bringing district visibility to life with SchoolAI
The pillars above (interoperability, real-time dashboards, role-based access) are exactly what a classroom AI platform needs to get right before it can be trusted district-wide. SchoolAI's Mission Control gives you the real-time layer: teachers see mastery data showing whether students are actually hitting the outcomes that matter, not just activity logs or time-on-task metrics. Every AI experience is teacher-designed and guardrailed, so visibility doesn't come at the cost of safety or control. Leaders get the rollup; teachers keep the driver's seat.
District data visibility isn't a luxury. It's how modern school leaders work. The districts that are scaling student achievement aren't doing it with guesses or hope. They're doing it with clarity: the ability to see what's working, where students are stuck, and what needs to shift. They're seeing their classrooms, really seeing them, and making smarter decisions because of it.
What's one classroom pattern you've wondered about but didn't have a clear way to see?
Curious what SchoolAI could surface in your district? Sign up today to get started, or request a demo to see it in action first.

About the author
Cheska Robinson
Education Specialist at SchoolAI, Former Instructional Technology Specialist
Cheska started her career as a science teacher, where hands-on learning and student curiosity shaped how she thinks about great classrooms. At SchoolAI, she partners with educators exploring practical, people-first ways to bring AI into their teaching, building professional learning that feels approachable, rooted in real classroom needs, and focused on keeping learning personal.
Transform your teaching with AI-powered tools for personalized learning
See how every student is doing, and know what to do next.