What school leaders should measure during the first month of AI adoption
Learn what school leaders should measure during the first month of AI adoption, from usage and safety to teacher impact.
Fely García López • Sep 9, 2026
School & District Leadership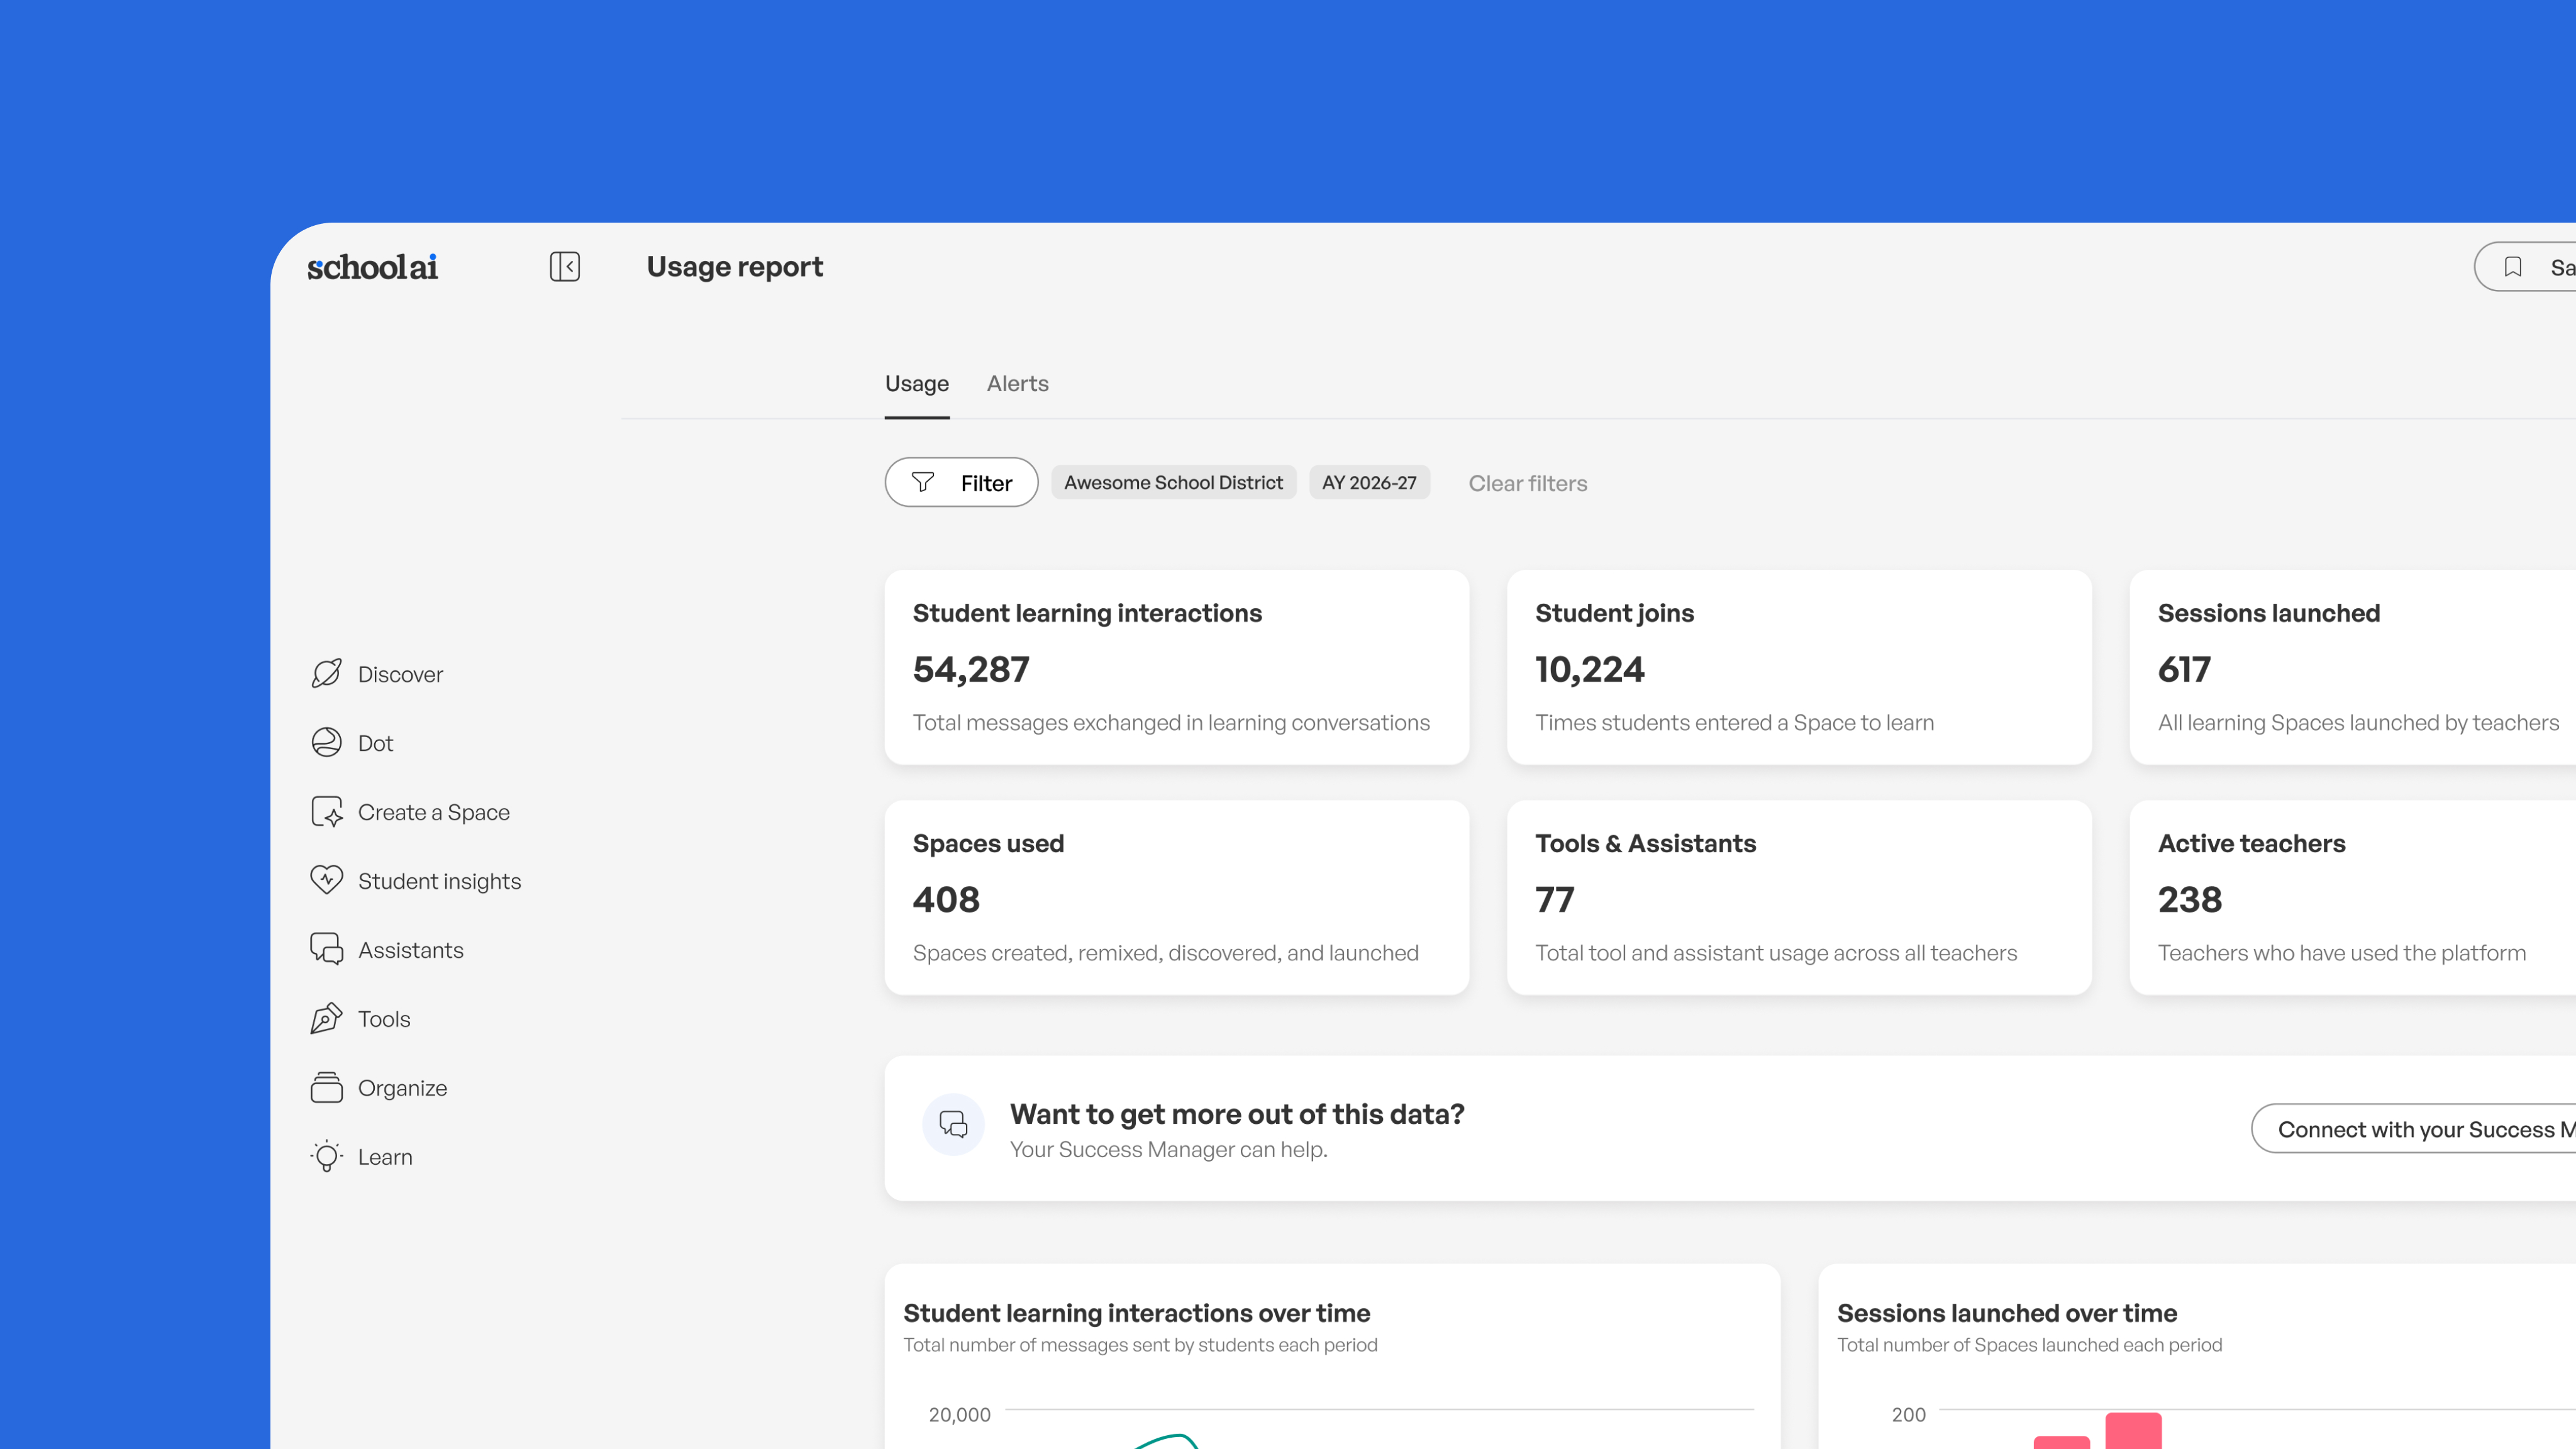
When we talk about measuring AI, it is tempting to begin with the dashboard. I would begin with the people. The first month of a rollout is not when you learn whether AI improves student achievement. It is when you learn whether your implementation is working for the teachers and students living inside it. Are teachers opening the approved tool? Are they coming back? Do they feel prepared, and do they know what they can and cannot put into it? Can every student get in, on the devices and connections they actually have? Those questions have answers right now. The ones about mastery and achievement need baselines and time. Treat these 30 days as a starting line rather than a verdict, and give yourself a month to find friction while it is still small enough to fix.
Key takeaways
-
The first month measures implementation health. Academic outcomes need baselines and more time than 30 days.
-
Access is not adoption. Repeat use, not first logins, is the earliest honest signal you have.
-
Low usage usually points to professional development, time, or unclear expectations before it points to resistance.
-
Shadow AI is information. It shows you where the approved option is falling short.
-
Platform data tells you what is happening. Teachers tell you why.
What successful AI adoption looks like in the first month
Success in month one means you have moved past handing out access. Access is a provisioning event. Adoption is a pattern of behavior, and the distance between those two is where most rollouts quietly stall. A strong first month does not require every teacher using AI every day, and it does not require a bump in any score. What it should show you is teachers coming back to the approved tools more than once, use spreading past the early adopters who would have tried anything, staff who can state the responsible-use expectations without looking them up, professional development participation and confidence rising, technical problems surfacing and getting fixed, and enough signal to see which use cases are worth building on.
Then sit with what teachers tell you. Login counts show whether people are using AI. They cannot explain why adoption is growing in one building and flat in another, and the teachers in both buildings already know the answer. You need the numbers and the people to make a decision you can stand behind, which is the same principle underneath building a district AI strategy that works.
1. Measure actual AI adoption and usage
Start by separating access from adoption. Provisioning an account creates a number in a report. A single login creates another one. Neither tells you AI has entered anyone's practice. Set your baseline in week one, then measure against it for the rest of the month, because week four is only meaningful next to week one.
Metrics school leaders should track
-
Weekly active users: the share of educators using the approved platform at least once a week.
-
Repeat usage: who comes back after a first session. This separates curiosity from a habit forming.
-
Frequency of use: how often active teachers return, and whether that rhythm is steadying.
-
Usage by school, grade, subject, or role: shows your strongest pockets and the groups needing different support.
-
Student participation: where student-facing AI is in the rollout, whether students join and finish what teachers designed.
-
Use-case distribution: planning, differentiation, feedback, student learning, communication. Where teachers go tells you where to aim professional development.
Be careful with targets built on login percentages alone. A district can post an impressive usage number while very little changes for the students sitting in those classrooms, and they are the reason we are measuring at all. Platform visibility like SchoolAI Mission Control reads best alongside the rollout practices that make adoption stick.
2. Monitor approved AI use, policy compliance, and shadow AI
The harder question this month is not whether people are using AI. It is whether they are using the environments you approved. Staff and students working in personal accounts and outside tools, often called shadow AI, leaves you without visibility into how student information is handled. That risk is real and worth naming plainly.
So is what sits underneath it. The reflex is enforcement. I would listen first. When a teacher goes around the approved tool, she is telling you something specific about access, functionality, communication, or professional development. She found a need your rollout did not meet, and she solved it the way teachers always have, quietly and on her own time. In month one, that is worth more to you than a compliance write-up.
Metrics and signals to monitor
-
Approved versus unapproved tool usage: which AI platforms show up across district systems, where you can track that appropriately and legally.
-
Policy awareness: a short pulse check on whether staff can name acceptable uses, prohibited data, and approved platforms.
-
Privacy or data-handling incidents: protected or personally identifiable information going into tools where it does not belong.
-
Questions and support requests: when the same question keeps coming back, your policy has a gap, not your staff.
Keep human oversight in the frame. Policy has to govern what happens before and after an AI response, especially how educators review material before it reaches a student. The roadmap for AI integration across districts shows how that fits the larger plan.
3. Track professional development reach and teacher confidence
Low adoption rarely means teachers are against AI. More often they have not had time to practice, are unclear on what is expected, or are not confident they can use the tool without doing something wrong. That last one is the quiet one, and it deserves your attention. Worry about getting it wrong keeps careful, conscientious teachers away far longer than any policy does, and those are often the teachers you most want using this well.
So measure participation and what happens after. Attendance proves a teacher was in the room. It does not prove she left ready to try something new on Monday morning with 27 students watching her.
Metrics to track
-
Completion rate: the share of targeted educators who finished foundational AI professional development.
-
Follow-up participation: coaching, PLC time, office hours, anything that continues after the first session.
-
Teacher confidence: the same 1 to 5 pulse question at launch and again near the end of the month.
-
Policy confidence: do teachers know which tools are approved, what they may enter, and when AI-generated material needs another set of eyes?
-
Support needs: let teachers name where they still want help: prompting, instructional use, student use, privacy, or judging accuracy.
Segment that feedback instead of reporting a district average. A middle school and a high school department can be in completely different places, and the average hides both of them. More on that work here: how to teach teachers to use AI.
4. Measure whether AI is saving educators time
Time is one of the few real outcomes you can evaluate honestly in 30 days, and it is the one teachers feel first. Ask about it carefully. "Did AI save you time?" produces a shrug. Naming a specific recurring task and asking teachers to estimate before and after produces something you can use.
Then track where that time goes. Time given back to a teacher matters because of what it makes room for, not because the clock moved.
1. Lesson and instructional planning
Compare time spent on first drafts, materials, differentiation options, rubrics, and supplementary resources.
2. Feedback and assessment support
Look at whether AI reduces repetitive drafting and analysis while teachers keep professional judgment over the feedback students actually receive.
3. Family and staff communication
Measure whether routine drafting and translation move faster without losing review or the personal touch families notice.
4. Student support
Watch for time moving out of prep and into interventions, individual feedback, and relationship building. That redirection is the whole point, and it shows up in teacher impact before it shows up anywhere else.
See what AI adoption looks like in learning
SchoolAI gives educators safe, teacher-designed AI experiences and real-time insight into student engagement and mastery.
5. Check infrastructure readiness, access, and equity
Adoption numbers will mislead you when some teachers and students cannot reliably get in. A teacher who loses ten minutes of class to a login problem in week one will not try again in week three, and you will read that as low interest. Look at access across buildings, grade bands, student groups, and instructional settings, because a district-wide average will tell you things are fine while a specific group of students is locked out.
First-month infrastructure and equity checks
-
Login and account access: are SSO, rostering, permissions, or provisioning keeping intended users out?
-
Device availability: which classrooms or student groups lack compatible devices?
-
Connectivity: recurring Wi-Fi, bandwidth, or loading problems during real classroom use, not during a quiet test.
-
Accessibility: does the tool work for students with different accessibility needs and accommodations?
-
Language access: can multilingual students and families participate fully, or does language quietly become the barrier?
-
Adoption disparities: compare participation across schools, grade bands, subjects, and student groups. District-wide availability is not equal opportunity to use it.
Multilingual students are often the last group a rollout checks on and the first group a barrier reaches. I learned English as a young adult, so I notice this quickly: when the tool, the instructions, and the confidence to ask for help are all in a language a student is still building, access on paper is not access. Check on those students in week one, not in the spring. More on that foundation: AI adoption challenges in schools.
6. Audit the quality and safety of AI-supported work
Usage volume without a quality check is a risk. A district can post strong adoption numbers while educators and students lean on responses that are inaccurate, biased, or disconnected from what students were supposed to learn. Sample a small number of AI-supported activities this month, and say out loud that you are not reviewing everything. The purpose is to find where people need support, not to put teachers under surveillance. Teachers can tell the difference, and the difference determines whether they tell you the truth next month.
What to look for during spot checks
-
Accuracy: are educators catching and correcting factual errors?
-
Instructional alignment: are these experiences tied to defined learning goals, or happening because the tool is there?
-
Human oversight: are teachers reviewing and adapting generated material before students see it?
-
Bias and representation: is anyone checking outputs for stereotypes, assumptions, or missing perspectives?
-
Student safety: are the experiences students meet age-appropriate and inside the boundaries their teacher set?
-
Quality of engagement: look past session counts. Are students reasoning, questioning, and revising, or collecting answers? Teacher-designed environments like SchoolAI Spaces make that easier to see.
7. Gather qualitative feedback that explains the numbers
Your dashboard shows what is happening. Teachers explain why. Both are data, and only one of them will tell you what to change. Keep it short: two or three pulse questions and a handful of real conversations will teach you more than a twenty-question survey nobody finishes. Ask near the start of the month and again near the end, so you can see movement in confidence and friction instead of one flat snapshot.
Questions worth asking educators
-
"What AI-supported task has been most useful so far?"
-
"Where have you hit the most friction?"
-
"How confident do you feel using the approved AI tools?"
-
"What information should never go into an AI tool?"
-
"Has AI changed the time you spend on any recurring task?"
-
"What professional development or support would make you more likely to use it?"
-
"Have you used another AI tool because the approved one did not meet a need? What was the need?"
Read the open-ended answers as implementation data. When the same comment arrives from four buildings, you have found a workflow, policy, or professional development problem that no usage chart was going to surface. Teachers will tell you the truth about a rollout when they believe you are asking in order to help them, not to grade them. Schoolwide AI readiness depends on catching those signals early.
How to evaluate your first 30 days of AI adoption
Start evaluating immediately, but evaluate different things on different timelines. Implementation health belongs to month one. Instructional and academic questions belong to a longer window, once you have a baseline worth comparing against. Bring usage analytics, professional development data, operational issues, safety information, and educator sentiment into one conversation. Separately, each is a partial story. Together they are a decision.
1. Compare adoption against the baseline
Are active and repeat users growing, and where is adoption concentrated or lagging?
2. Identify implementation barriers
Sort the problems by cause: access, infrastructure, unclear policy, thin professional development, poor workflow fit, or the tool itself.
3. Identify early value
Find the use cases where teachers consistently report saved time, better visibility, or stronger support for the instructional work they already care about.
4. Decide what needs to change next month
Adjust professional learning, communication, policy, access, or the scope of the rollout. Do not scale because login numbers look good. Scale when usage quality, safety, teacher experience, and the goals you started with all point the same direction. An AI roadmap for K-12 administrative teams makes that sequencing easier.
What to measure next: From AI adoption to student outcomes
This first month builds the foundation for the questions you actually care about. Is AI helping teachers teach more effectively? Are students reaching the outcomes your district set out to reach? Once implementation is steady, compare adoption data against longer-term indicators: student engagement, evidence of mastery, instructional quality, educator capacity, and academic results.
Resist the causal claim. An outcome that improves after an AI rollout is not proof that AI caused it. Establish baselines, compare relevant groups and time periods, and treat AI as one part of an instructional environment with many moving parts. This work is slow, and it is worth doing carefully, because the students in those classrooms only get this year once.
The next step is measuring what happens inside the learning itself. SchoolAI gives students teacher-designed, guard railed experiences and gives educators real-time student outcome data showing whether students are reaching the goals their teachers set. That is the path from "is anyone using it?" toward the question worth sitting with: is this supporting the learning we intended, for the students who need it most? Request a demo or sign up today.

About the author
Fely García López
Education Specialist at SchoolAI, Multilingual Educator
Fely spent 20 years in education before joining SchoolAI, most recently as Educator Innovation Lead at Microsoft, where she focused on bringing ed-tech tools into everyday teaching practice. She learned English as a young adult and knows what it feels like to sit in a room where the words move faster than you can hold them. That experience shapes how she works with schools today, focusing on language-aware instruction and practical AI integration that guides students toward their own answers rather than handing answers over.
Transform your teaching with AI-powered tools for personalized learning
See how every student is doing, and know what to do next.